What is TTFB and why it matters for website speed and SEO
During our visit to WordCamp Gdynia this past September, our dev team was inspired by one particular session. Remkus de Vries talked about how mere caching isn’t solving performance problems and instead explained why and how TTFB matters. Almost instantly, our team members sat and performed some initial tests that later transpired into something more.

Hence, this article and detailed explanation about not only why TTFB is important but also why it is and we’re excited to share with you.
What is TTFB (Time To First Byte)?
Time To First Byte (TTFB) measures how long it takes for your browser to start receiving the first piece of data from a website after you request it. In simple terms, it shows how quickly a web server responds when you try to load a page.
In more practical terms, TTFB includes:
- DNS lookup time
- TCP connection establishment (and TLS/SSL handshake if applicable)
- Server processing time (application logic, database queries, caching)
- The initial part of the response leaving the server and travelling across the network to the browser.
That means that, even before the browser can render visible content (like a heading, image or text), TTFB is what defines the first server-response latency.
Why is TTFB important?
In short, TTFB is important because a faster response from the server means the web page starts loading sooner, improving user experience. If TTFB is high, everything else is delayed and it directly impacts UX.
It also matters for SEO, as search engines favor sites that load quickly. And although TTFB itself is not one of the Core Web Vitals defined by Google, it sure plays a key role in the chain of events that affect those metrics. Search engines take site speed and server response latency into account as user experience signals and high TTFB affects that. By web.dev’s recommendation, “most sites should strive to have a TTFB of 0.8 seconds or less. Good values are 0.8 s or less; poor are greater than 1.8 s.”
While TTFB metric may not be that significant on smaller websites with less traffic, on a larger website with increased traffic, all these milliseconds add up and put additional load on a server, thus affecting response time and page load speed.
What we measured and why
We wanted to see how different page builders for WordPress affect TTFB – basically, how much each one adds to a page’s response time.
Testing setup
- CMS: WordPress 6.8.3
- Hosting: Single DigitalOcean droplet
- Server: 4 GB RAM / 2 Intel vCPUs / 120 GB SSD
- Location: Frankfurt (FRA1 datacenter)
- OS: Ubuntu 22.04 with Apache2
- Caching: Cloudflare enabled
Client environments
From Latvia
- Browser: Chrome on macOS
- Connection: 5G (Download 23.15 Mbps, Ping 25 ms)
From Slovakia
- Tool: curl on macOS
- Connection: Wired (Download 367 Mbps, Ping 35 ms to Frankfurt)
Pages we tested
- We created identical, minimal test pages out of this homepage: Gutenberg (core WordPress), each containing a single text element – using the most popular page builders (without plugins/custom themes):
- WPBakery
- Elementor
- Divi
- Bricks
- Beaver Builder
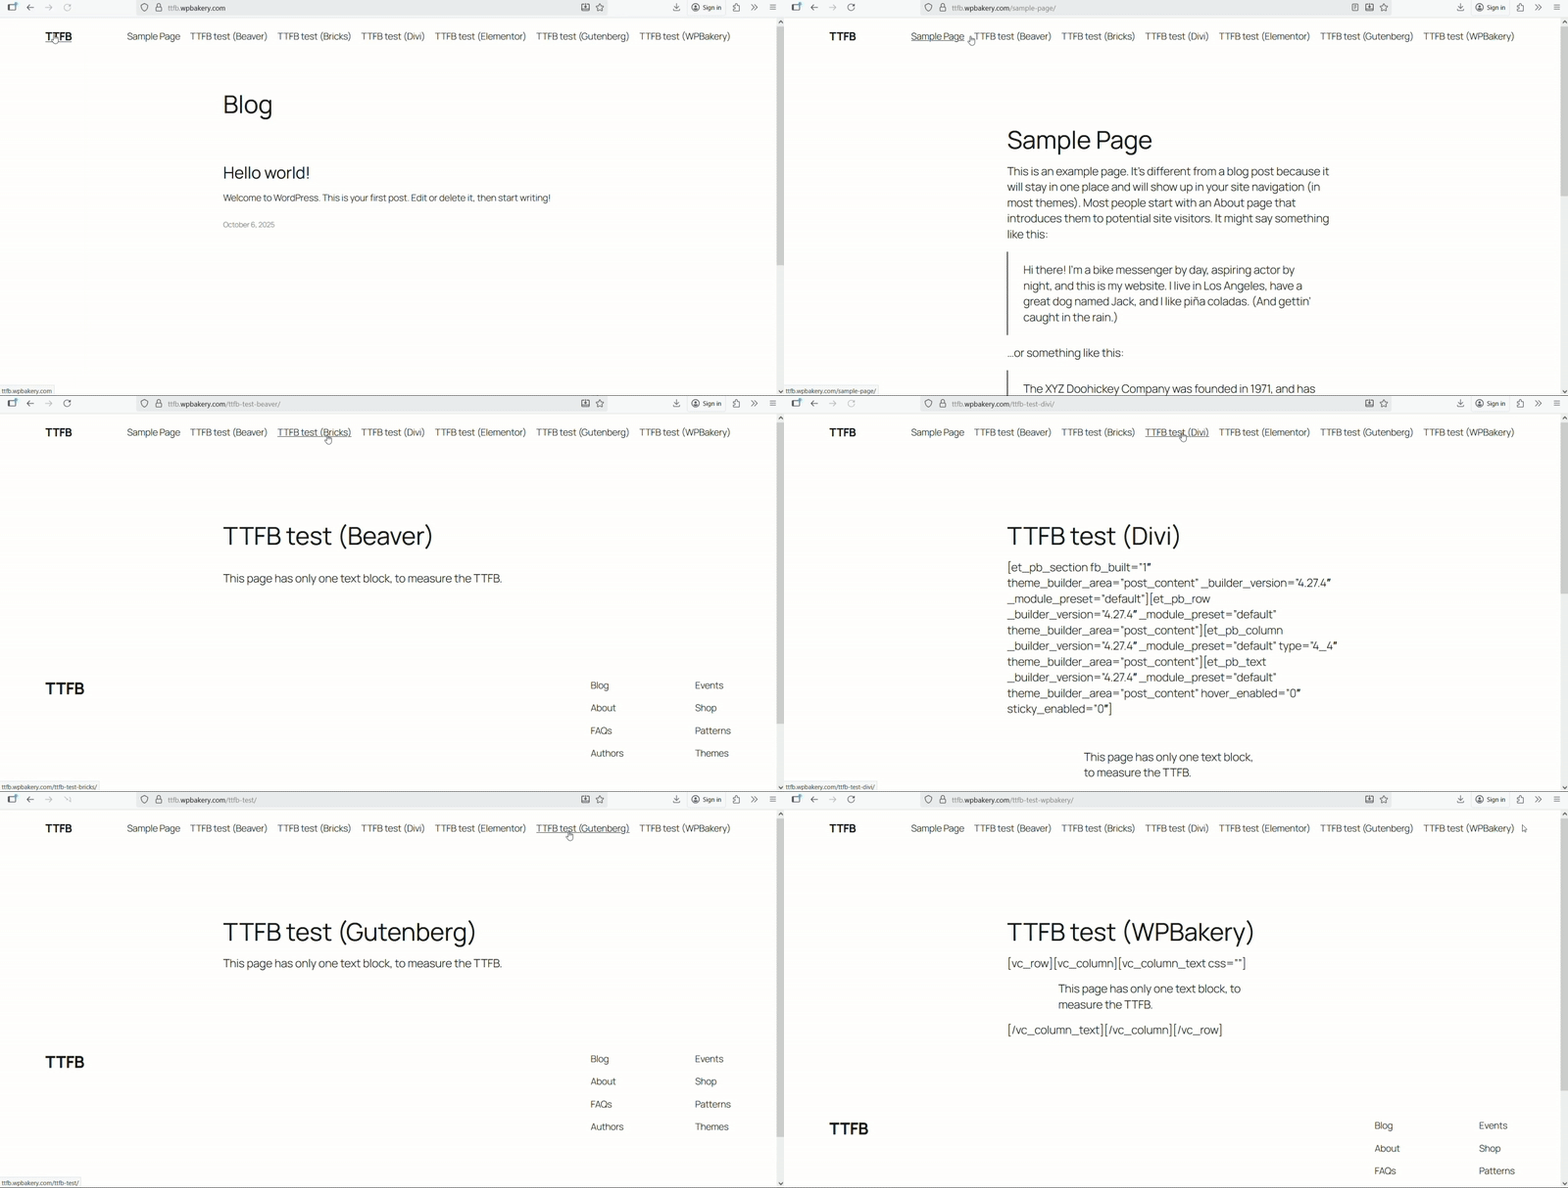
We ran two sets of tests in comparison to the WPBakery Page Builder:
TTFB of a page created with each builder – only that plugin/theme was active.
- No plugins active, page created with Gutenberg, containing a single text block.
- Only the Elementor plugin is activated, a page created with Elementor, containing a single text block.
- Only the Beaver plugin is activated, a page created with Beaver, containing a single text block.
- Only the Divi plugin is activated, a page created with Divi, containing a single text block.
- Only the Bricks theme is activated, a page created with Bricks, containing a single text block.
- Only the WPBakery plugin is activated, a page created with WPBakery, containing a single text block.
TTFB of the homepage – measured when the builder was activated but no extra content was added
- No plugins active
- Only the Elementor plugin is activated
- Only the Beaver plugin is activated
- Only the Divi plugin is activated
- Only the Bricks theme is activated
- Only the WPBakery plugin is activated
All results are available in this public spreadsheet, as well as here:
| No | WordPress/Gutenberg | Elementor | Beaver | Divi | Bricks | WPBakery |
|---|---|---|---|---|---|---|
| 1 | 137.83 | 215.25 | 236.51 | 399.03 | 219.83 | 160.1 |
| 2 | 139.59 | 228.34 | 203.65 | 245.07 | 277.89 | 223.73 |
| 3 | 139.71 | 222.63 | 191.19 | 323.59 | 188.69 | 201.19 |
| 4 | 172.06 | 234.48 | 224.71 | 287.66 | 199.7 | 182.03 |
| 5 | 201.48 | 257.56 | 192.4 | 435.06 | 187.7 | 185.92 |
| 6 | 146.5 | 221.78 | 221.2 | 271.68 | 209.76 | 180.8 |
| 7 | 159.86 | 183.46 | 176.65 | 341.65 | 276.07 | 180.94 |
| 8 | 312.4 | 229.18 | 246.06 | 272.1 | 185.84 | 195.73 |
| 9 | 167.18 | 283.04 | 212.19 | 321.88 | 294.41 | 179.75 |
| 10 | 170.51 | 248.14 | 205.39 | 293.23 | 220.84 | 186.4 |
| Average | 174.71 | 232.39 | 211.00 | 319.10 | 226.07 | 187.66 |
How we measured TTFB
We followed Google’s recommended methods for lab testing TTFB:
- Network panel in the Chrome DevTools, under the Lab tools section
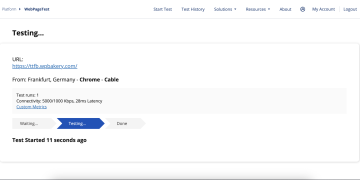
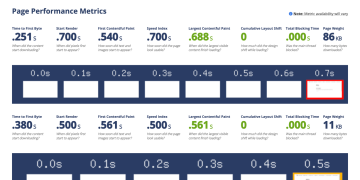
- WebPageTest online tool, under the Lab tools section, as well as
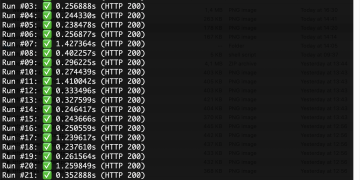
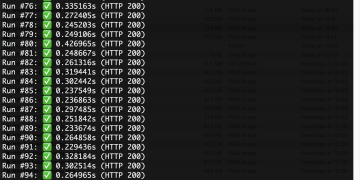
- Custom curl script
Network panel in the browser’s DevTools
Measurements were done with each plugin out of the box settings, meaning the plugin just got activated and the page created, no other plugins were active at that time.
Each measurement was taken for a single page with an empty cache and the hard reload option each time, meaning we had to click on the empty cache and hard reload button for each measurement. (This was done 10 times, with an average value taken as a final result. See the table and/or the spreadsheet.)
WebPageTest online tool
Each page was measured 10 times with the www.webpagetest.org online tool, the selected location to measure from was Frankfurt, Germany (closest to the hosting).
WordPress instance had a Twenty Twenty-Five and only one plugin (one builder) installed for each test case, except Bricks, which is bundled with its own theme. Each result in the table is in milliseconds, e.g., 203.51ms.
cURL script
We’ve created a custom curl script, that makes 100 requests to a specified page, and would return a minimal TTFB value, maximum TTFB value and an average TTFB value.
Why multiple tools?
Different tools simulate different real-world scenarios:
- No caching or persistent connections: Browsers reuse existing connections (HTTP keep-alive), while curl starts a new one each time.
- No DNS or TCP optimizations: Browsers cache DNS lookups and use faster connection handling.
- Different network stacks: Browsers are optimized for performance, while curl prioritizes accuracy and transparency.
- Server behavior: Some servers prioritize real browsers over command-line clients for speed or content delivery.
WPBakery case study note
While we tried to stay objective during this experiment, we understand that the results may be different depending on the server configuration, hosting configuration, client environment (browser, OS, location), network connectivity, as well as the number of requests to the server. These results provide a rough estimate of what users can expect from each page builder.
Regarding Bricks, it’s not a plugin, but a theme instead, so it uses a different environment, meaning no default WP theme, but instead a blank Bricks theme, with no Header, Footer, Menu, etc included. So, while their results may look better than others, keep in mind that no other content on the page exists. Fewer PHP functions/methods calls – faster response generation time.
For WPBakery, we use a module system, where users can disable parts of the plugin that they are not using (e.g. AI or SEO), which can impact TTFB in a positive way. Users can disable unused modules and TTFB results will improve slightly.
Conclusion
TTFB is a simple yet powerful metric: it tells you how quickly your server begins to respond to a user request. For website performance, user experience and SEO, it matters because if the server takes too long just to start sending data, everything else is delayed.
To make the most of TTFB: measure regularly, reduce server and network latency, optimize your server-side logic, use caching and CDNs and keep a holistic view of performance (not only TTFB but what happens afterward).
We hope this research sheds light on the importance of this metric and helped you learn new things. Ending with the resources and tools we used and if you have any comment or insights to share – we invite you to do so in our community and let’s talk!
Resources
In depth information about Time To First Byte (TTFB)
Tools
Tools to measure TTFB metric:
